
|
|
#47
 01-06-2017, 08:45 PM
|
|||
|
|||
|
Quote:
__________________
Fred 
|
|
#48
01-07-2017, 09:38 PM
|
||||
|
||||
|
About six years ago I was looking for a tweener to some extent. I ended up going with a three piece back. Two pieces of Vietnamese Rosewood and one of Tasmanian Blackwood, with a cedar top. Worked like a charm.

__________________
"Better a witty fool than a foolish wit." New Album Pandora Spotify FOR SALE: MIKTEK CV4 Tube mic Various Shock Mounts 2019 Alvarez ABT60 SHB-E Baritone guitar Shoot me a PM if interested
|
|
#50
01-08-2017, 11:38 AM
|
||||
|
||||
|
Quote:
 ... math was never my strong suit. ... math was never my strong suit.The guitar is my Brook Taw. She looks great and sounds even better.
__________________
"Better a witty fool than a foolish wit." New Album Pandora Spotify FOR SALE: MIKTEK CV4 Tube mic Various Shock Mounts 2019 Alvarez ABT60 SHB-E Baritone guitar Shoot me a PM if interested
|
|
#51
01-14-2017, 11:44 PM
|
|||
|
|||
|
Quote:
I love Koa with cedar I also Love the Cocobolo with Sinker The rosewood I saved for the 12 string with engleman top.
|
|
#52
01-15-2017, 07:22 AM
|
|||
|
|||
|
Heya,
May I kindly suggest you give Australian Blackwood a shot? I personally find that it's a great tweener between Rosewood and Hog! Here's a link to my NGD last year: Shane Briggs Model One Italian Spruce/Australian Blackwood Mind you, the builder is important too! I asked my luthier to give me that 'dry rosewood' sound that's also a 'wet hog' sound hahaha... Simply put, it's got the trebles of a rosewood and the definition and push of a hog, can you ask for anymore than that? Here's a youtube vid of it in action!
|
|
#53
01-15-2017, 03:48 PM
|
|||
|
|||
|
Again; wood choice sets limits and offers possibilities. Damping is probably one of the limiting factors. From what I've seen it's distressingly easy to make a bad guitar from good wood, and I suspect that one of the ways to do that is to brace it 'wrong', so that the damping of the system is higher than it could be. I put wrong in ellipses because the best way to brace a top or back can vary a bit from one piece of wood to another, and depending on what sound you're looking for. What's 'right' for a mahogany back might be 'wrong' for rosewood. In any event, It's probably not possible to make the assembled box have lower damping than the materials it's made from do, but I'm sure the damping can be made higher.
Damping is often expressed in the form of a 'Q-value' or 'quality factor'. There are a couple of ways to find it which can give slightly different numbers, but properly interpreted they can tell you the proportion of energy that's dissipated per vibration cycle. That is, if the Q of the system is 100, then 1/100th of the energy is 'lost' per cycle. If you think about it, this means that, all else equal, high frequencies will tend to be damped out more quickly than lows. High frequencies have more cycles per second, so it takes fewer seconds for the sound to die out if the damping is the same. Thus low damping woods should tend to give a soun with more high frequency components. That's what I was when I made a 'matched' pair of Classicals with oak and BRW for the B&S: the oak had higher damping, and less high end sound. Of course, it get more complicated than that. After all, we're talking about guitars here. 
|
|
#54
01-15-2017, 04:30 PM
|
|||
|
|||
|
Quote:
|
|
#56
01-15-2017, 05:20 PM
|
|||
|
|||
|
Quote:
I might be opening a technical can of worms here. I mean.. in a nutshell. Does it require sensitive lab equipment to measure it or can the hobby luthier set something up in their basement shop.
|
|
#57
01-15-2017, 07:35 PM
|
|||
|
|||
|
Quote:
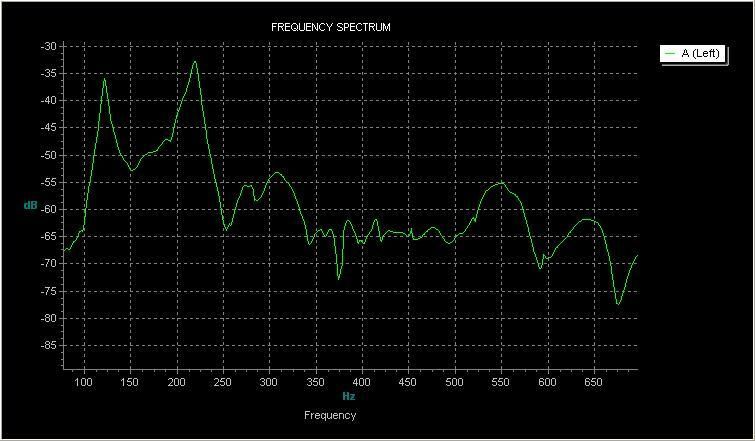 To get the Q of the different resonant frequencies in the plot you need to measure the resonant frequency peak and the lower and upper frequencies where the plot is 3 dB down from the peak. The lower and upper 3 dB points identify the bandwidth. The bandwidth is (upper frequency - lower frequency), which is equal to the resonant frequency (fc) / Q. The Fc is the resonant frequency and the c is suppose to be subscript. So Bw = Fc/Q  Anyway what we care about is the equation in the form of Q = Fc / Bw. In the above plot the above hole resonance is 122 Hz, it was a small guitar. Just for the heck of it we will say that the peak is 3 dB down at the -40 dB point. We would measure the two frequencies at -40 dB, subtract the lower from the upper and then divide this number into the resonant frequency, giving us the Q at this resonance. We can do the same for the top resonance, the peak at around 220 Hz, even the broad peak at 550 Hz. Lot of resonances in a guitar to make things interesting. Not a great expense in a test setup, the above plot was done with the guitar suspended from its ends and a mic ungraciously hanging down from a stick. The top was excited by taping it with an eraser tapped to the end of a stick. (points added to my score for using one volume of the Gore & Gillet book to elevate the guitar off the floor) The guitar actually turned out to be a dog, used it to mess around trying ideas for painting a burst. 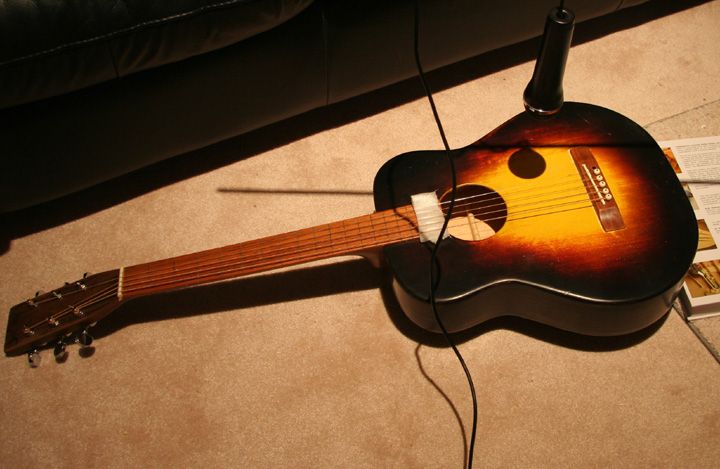 But how about a board that you have not used to make the guitar yet? Since our dimensioned boards are pretty much a 2d structure we are concerned with the lengthwise and width wise resonances. If we tap a board with our eraser mallet we would get a resonance with two nodes where the board remains mostly stationary. Something like this.  We want to suspend the plate at these nodes to measure the resonance along this direction. In the width wise direction we would have different node points and a different frequency and most likely different Q for the different directions. Wonderful, I found a relevant picture. Sorry for the large size. 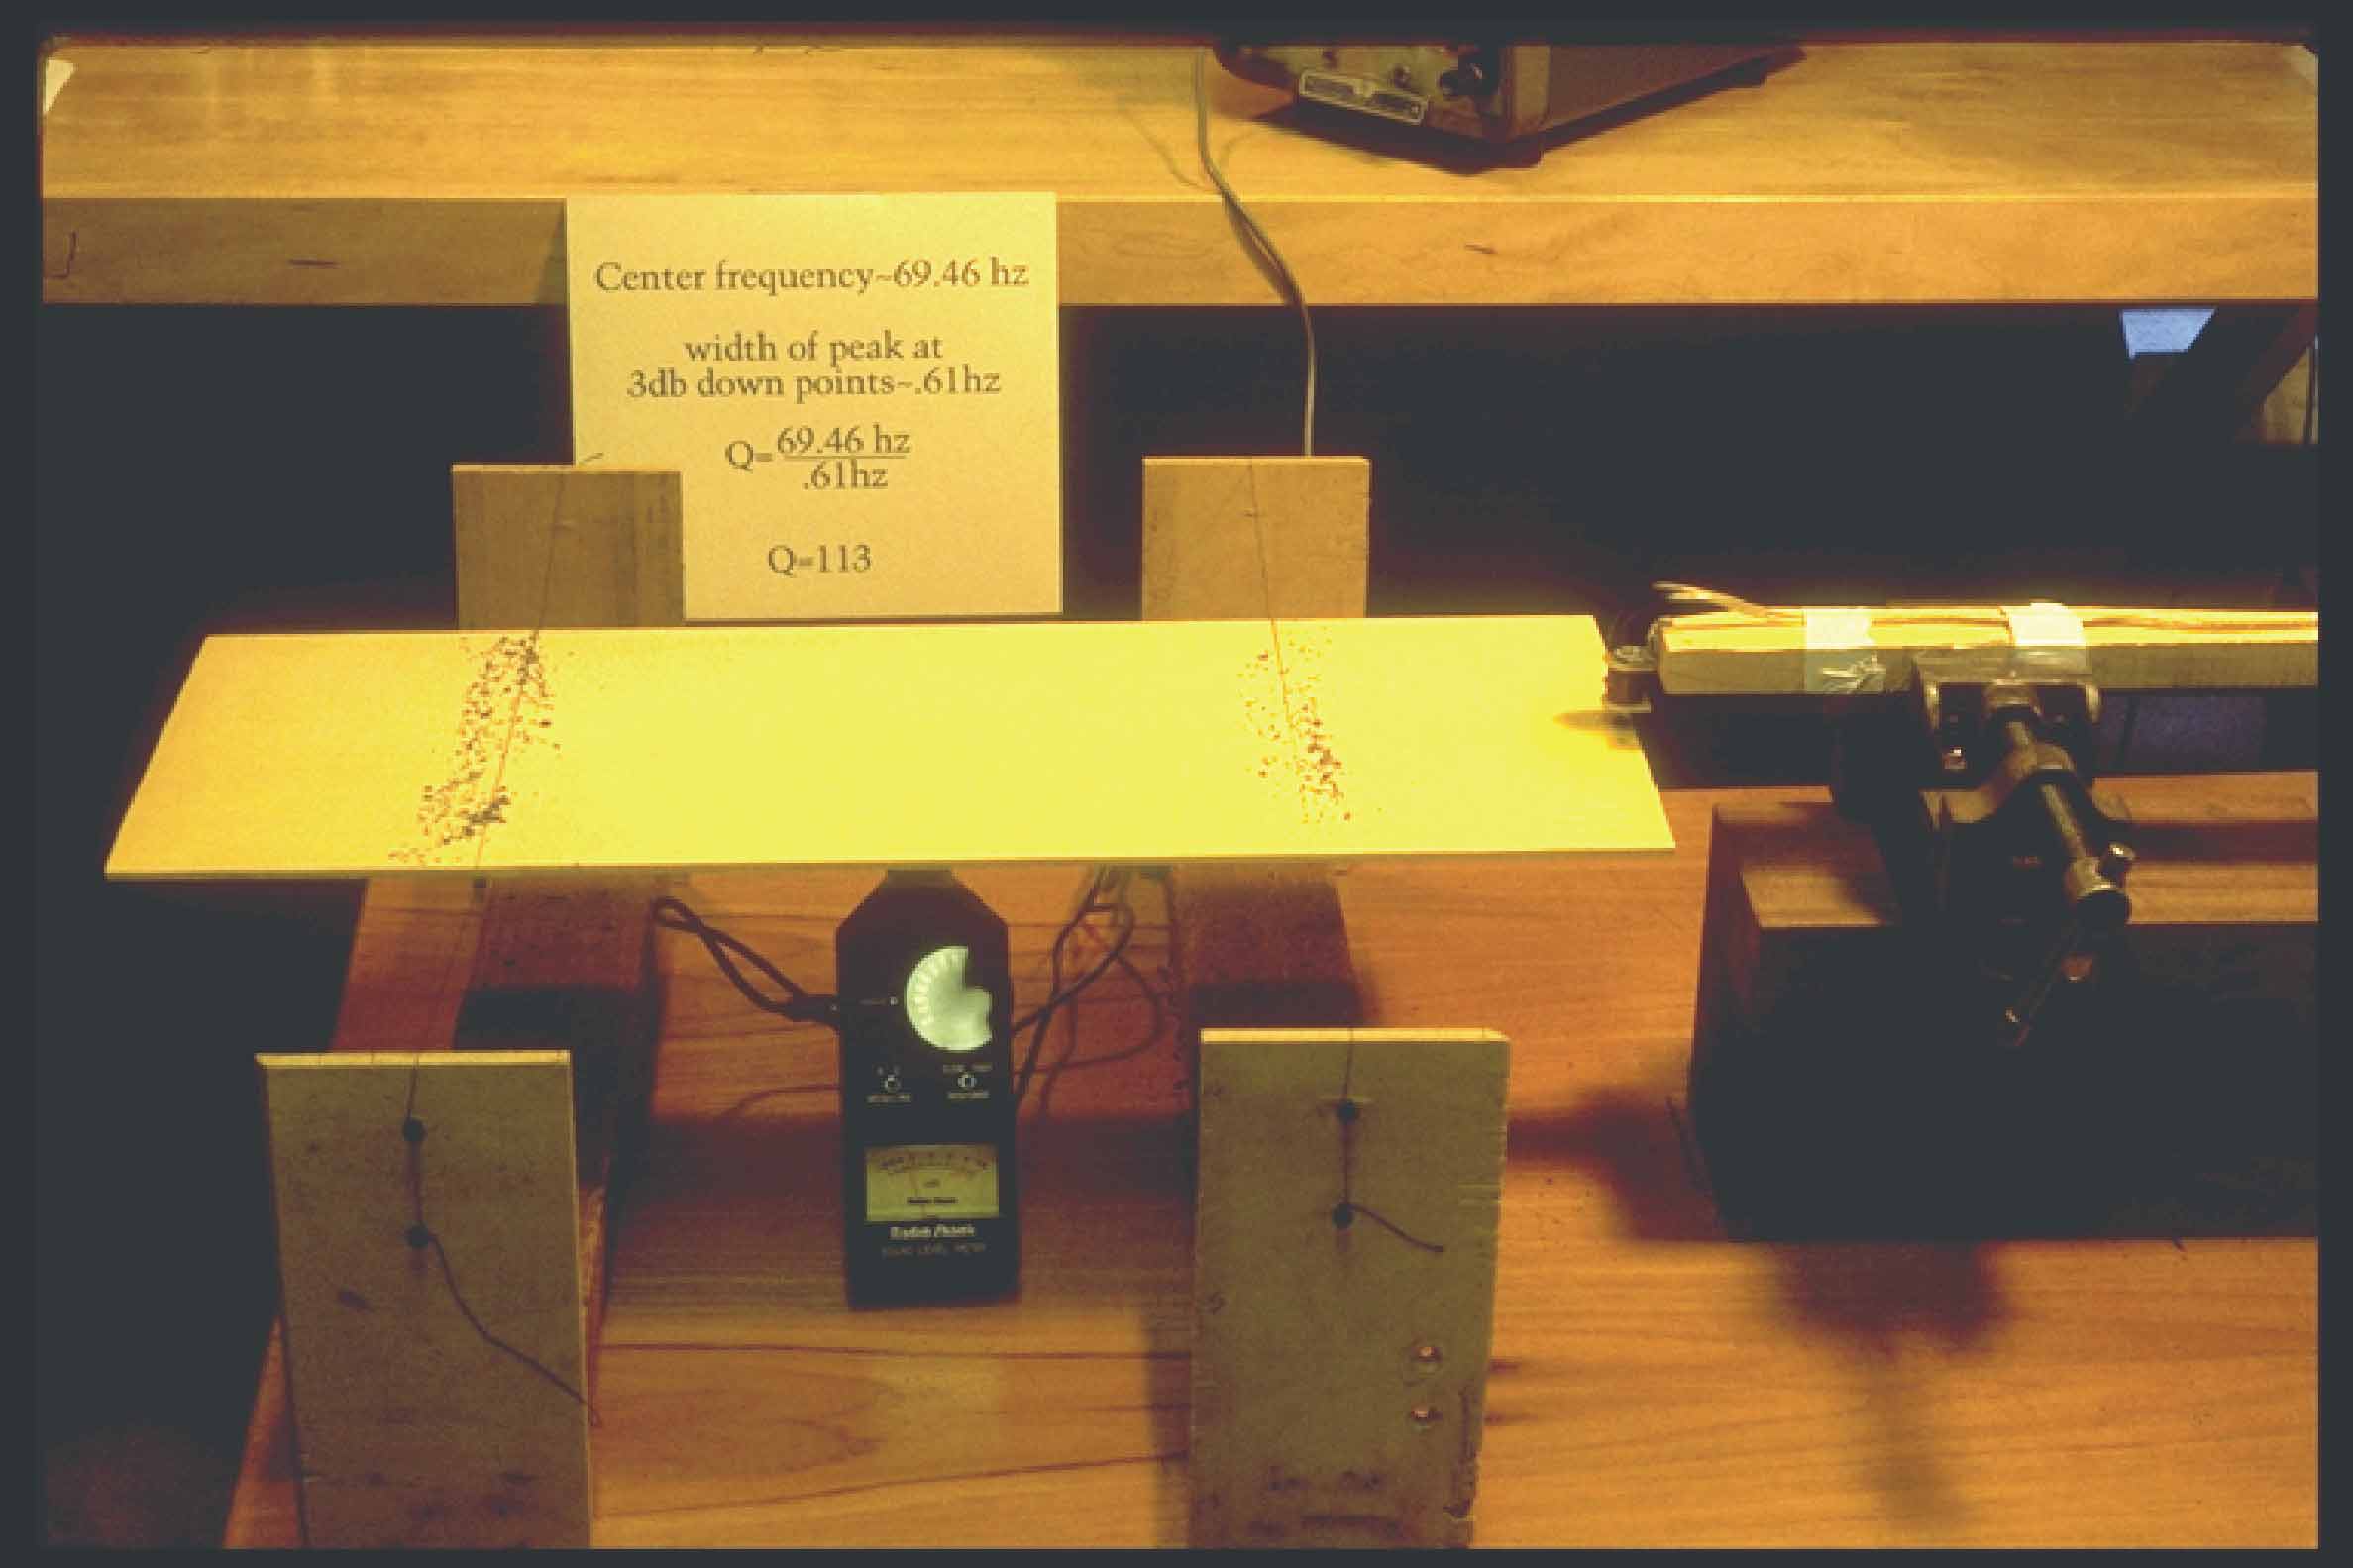 I was envisioning the plate being suspended at the nodes with elastic bands and tapping at the center, this set up excites the plate at the edge and suspends the plate with some wires. The plate is excited continuously and I am guessing the excitation frequency is varied with the audio meter used to determine the peak output at the resonant frequency and at -3 dB, the bandwidth frequencies. So different ways to skin a cat. Enough in the nutshell?
__________________
Fred
|
|
#58
01-16-2017, 02:38 PM
|
|||
|
|||
|
I use a signal generator to drive top or back halves. There are apps that will make the sound, so all you need to do is amplify it. I drive with a speaker, and stick a small piece of iron onto the plate. The motion can then be read off with a magnetic pickup and a DVM. This enables me to get the peaks and 3dB down points very accurately. With those numbers along with the size and mass of the piece I can calculate the Young's modulus along and across the grain, as well as the damping factors. Although this is easy enough to measure in principle it gets more complicated in practice.
One problem is that in a piece as wide as a top or back half there can be other resonances close in pitch to the one you're trying to look at. When this happens the two can 'couple'; what you're seeing and hearing is some combination of them, rather than a 'pure' mode. If, for example, there is a mode that involves twisting of the plate along with bending the reult you get will include a contribution by the shearing moduli of the plate, along with the attendant damping factors. This coupling will be obvious if you can look at the mode shape, but you might miss it if you just hold and tap. Usually, of course, a spectrum plot will show other peaks in the same frequency neighborhood, but then you might have trouble figuring out which is which. Again, in theory you can get around that problem by testing a narrow strip of wood, so that when you look at the lengthwise bending, say, any crosswise bending or twisting modes will be much higher in pitch and out of range. Then you have to wonder if the strip you cut is really representative of the whole plate. You could, of course, cut the whole thing into narrow strips, but then you can't make a guitar out of them. Grain anomolies, such as run out or knots, can mess things up. Wood that grew with a twist, so that the run out changes as you go across th width, can be a challenge. Most top wood shows at least some of that. There is also the question as to whether there really is such a thing as 'the' Q value of a piece of wood. Daniel Haines checked out numerous samples of wood at different pitches. He would cut a long strip, get the Q values aty several different resonant pitches, and then cut it doown a bit to test other frequencies. The Q value seems to vary with frequency, although he was not sure if that was really a wood property or just an artifact of his measurement methods. Different species varied in slightly different ways. This is an area where a lot more data sould be needed to get a clearer picture. Just because, say, BRW has much lower damping than maple at the low frequenices where we usualy test it, that doesn't mean the tables can't be turned at a higher frequency. It's hard to think of why it would vary at all, let alone how that would relate to different species of wood. The one thing we can be pretty sure of is that settling the question would require a lot of tedious work. Finally, we need to figure out what, if any, effect it has on the sound. Wright's study suggested that people can't hear even fairly large changes in materail damping, but thart was necesarily donme using a computer model of a guitar to generate the tone. Since it's at least very difficult to make 'identical' guitars that sound the same such a model is about the only way to test that proposition, but such models have limits, especially when that was done in the mid-nineties. WE can think of things that ought to happen, of course, but relating the way a guitar vibraters with people's imprssion of 'tone' is always challenging.
|
|
#59
01-17-2017, 09:41 PM
|
|||
|
|||
|
Interesting. It does seem like a lot to go through for what seems is not very reliable results. I won't beg the question and hijack this thread though, it looks like books could be written on it and probably have. Suffice to say, knowing that generally speaking ebony has more damping then rosewood is good enough for me

|


