
|
|
#196
 03-11-2018, 08:08 PM
|
|||
|
|||
|
The graph shown has two number, the vertical and the horizontal. The stiffness is measure with the grain vertical as in how we like to use the wood or with the grain horizontally with the grain running flat across the top. You would see the cathedral grain pattern. You can see where the dots land, the vertical grain direction is stiffer than if the board was cut and we had horizontal grain.
Now the horizontal grain is not that bad, what is worse is if the grain is running at a 45 degree angle, that cut of wood has the least stiffness. But given that we use quartered wood the vertical grain axis of the chart is what we would be concerned with. Don't be too concerned with the numbers other than seeing the same species can have wood that is twice the stiffness as the least stiff sample. In our perfect piece of wood we have the grain at 90 degrees and it runs straight and true. So we have one board of the top set and we measure the young's modulus. This is from a ukulele builder that does a lot of testing and shares his methods. A bar of known weight gets placed on the sample and a dial gauge is used to measure the deflection. The distance is known, throw the weight, the size of the board and the deflection into an equation and out pops the YM. The test rig has different bar spacing so that you can measure the YM across the length of the board and the width. The two numbers are different, the wood is stiffer lengthwise on our top than it is width wise. 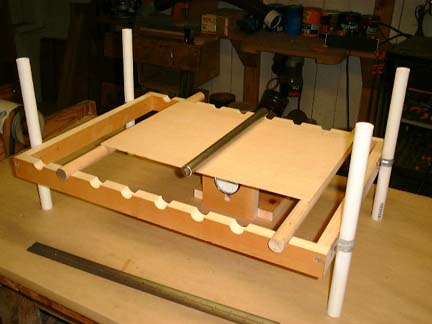 So we test the wood, how much can the stiffness vary? The previous graph says that one peace can be twice as stiff as the other, or the one half the stiffness of the other. So how do you brace the guitar? You do not want any failures so you brace for the weakest board. So you are bracing the one wood more than it has to be. There are a few things that effect the stiffness of the board. As the grain is cut off quarter the stiffness goes down. So if the person cutting the tops from a log is diligent and will eat some waste each board will be at 90 degrees. That rarely happens in practice. The first board set might be at 90 but the next one might be a little less. Same with the next, then the next, on down. AAA graded wood should be at close to 90, A grade might be at 5 - 10 degrees of 90. The wood stiffness goes down but the weight of the board stays the same. As you change the stiffness of the board but the weight stays the same the resonant frequency of the board goes up. Less stiff the frequency goes down. Another graph.  We said the resonant frequency of the board goes up and down depending on the stiffness and it also goes up and down with the different mass of the board with the same stiffness. The next graph shows the density and it can be also a 2:1 swing. Now the other axis shows that as the density goes up so does the stiffness. This is great, the one should cancel out the other, the light not so stiff board should have the same resonant frequency as the stiff heavy board. Sadly I don't think it is a 1:1 ratio. Oh, before I forget, runout. The sawer could be diligent and is cutting every board at 90 degrees. He cuts the log into quarters and goes to work cutting tops. But if the tree has any twist, and most do, the fibers will not run the length of the log but enter in one side of the board and exit through the other. You might have a runout of on inch for every 12 inches of run, you might have on inch per 24 inches of run. The board with less runout will be stiffer than one without even though it is the same piece of wood. Some sawers split the logs and try to adjust for runout, some don't. So we have a number of things that effect the stiffness of the board. And then one tree might have better genetics than the other and be stiffer or grew in better soil condition. The one thing that does not seem to matter too much is gain per inch. But that is the one thing people see on their guitar that they have been lead to believe signifies a better top. And that is just the top wood. Part of the equation is the bracing. Was it cut at 90 degrees.... all the same variables as above. And then you have the back. It's wood also has variability and it changes the frequency that it resonates at. Put a top that can have a variable resonant frequency with a top that has a variable frequency and with braces that can add different amounts of stiffness to each. Add together and shake, yeah the result can be all over the place, well at least in a range. The problem with the range is it can fall on one note's frequency, in between it and the next note, or on the next note. All with the same material dimensions just different wood.
__________________
Fred 
|
|
#197
03-11-2018, 08:11 PM
|
|||
|
|||
|
Quote:
Quote:
Quote:
If these were truly high performance guitars, and were sufficiently responsive for these frequency variations to matter, then there would have been wolf notes and intonation problems on some of these guitars and some would have sounded very different to others, but French and Brubaker were silent on this matter. The acoustic variation measured is almost entirely due to material engineering property variations, as most guitar wood is graded solely on cosmetic features and the mechanical and acoustical properties are rarely if ever measured in guitar production processes. Interestingly, if a histogram is drawn up of the resonant frequencies (yes, I did that), a bell curve appears with the means centered exactly between scale tones. So, on average, the resonances were in the the right places to avoid problems, but that is sort of like telling a bloke with one hand in a bucket of ice and the other in the fire that he should be comfortable (on average). The guitars measured were all X-braced (Martin inside!). However, just switching to some other bracing scheme isn't going to alter the outcome that French and Brubaker reported if the resonant frequencies aren't controlled.
|
|
#198
03-11-2018, 08:37 PM
|
|||
|
|||
|
In response to the reply regarding the figure on the previous page:
"what is it actually measuring and actually showing?" - Young's Modulus of Elasticity, which is a measure of stiffness. The values were determined in a standardized test of deflection of each of the 80 Sitka spruce samples under a standard load. From the length of the sample and the measured deflection under a standard load, the modulus of elasticity can be calculated. Each sample was measured in the vertical grain orientation (also referred to as quartersawn) as is used in guitar tops, and with the grain in the horizontal orientation (to address a long standing question about the relative stiffness of vertical grain versus horizontal grain which is a whole separate subject). Each data point in the figure represents the two values for each of the 80 samples and represents the stiffness of each sample in each orientation. "So assuming for now Youngs modulus numbers are actually being correctly used. " - A main point of the article was describing the method in detail. Too much detail for me to go into here. In addition to being a luthier, the author of the study was a a structural analysis engineer for many years at Boeing so I think we can safely assume he knows what he was doing here in setting up a relevant standardized testing method. "7000 or 8000 arbitrary units of measure does not mean that amount of variation cannot be addressed by a standardized mean bracing spec." - There's nothing arbitrary about the units. The units are right there in the figure: MPa The bottom line from this figure is that if you built 80 guitars from the 80 top sets the samples in the study came from (assuming all the other materials were the same as possible) and used mass production methods with uniform thickness tops and CNC-cut uniform braces, there's no way the guitars would sound and perform alike. If you wanted all 80 guitars to perform alike, you would have to adjust the thickness of the tops and/or modify the bracing to account for the wide range in the stiffness values of the top materials. Last edited by Shuksan; 03-12-2018 at 12:05 AM.
|
|
#199
03-12-2018, 12:21 AM
|
|||
|
|||
|
Quote:
I think nice happy in betweens can be found with a design but really every set of materials will need slightly different "tweaks" or parameters. and to Trevor, thanks for your explanations
__________________
http://www.jessupegoldastini.com/
|
|
#200
03-12-2018, 04:33 AM
|
|||
|
|||
|
This is all very interesting. For me, and I suppose for most players, is 'how does it sound'? I am very sceptical by nature and have owned a number of Taylor guitars over the years. Currently have a PS16ce and a 562ce. Last week, I had the opportunity to play all three of the new V models.
For me, they do sound different. Better? that's very subjective. The way I described it to Simon from Taylor UK was it was as if in eq terms, the bottom had been slightly boosted and the top wound off a touch. For those familiar with the bright Taylor sound, you may prefer the sound of the V braced guitars, you may not. I certainly wasn't convinced that I had to rush out and buy one.
|
|
#201
03-12-2018, 07:42 AM
|
|||
|
|||
|
Quote:
__________________
Guild CO-2 Guild JF30-12 Guild D55 Goodall Grand Concert Cutaway Walnut/Italian Spruce Santa Cruz Brazilian VJ Taylor 8 String Baritone Blueberry - Grand Concert Magnum Opus J450 Eastman AJ815 Parker PA-24 Babicz Jumbo Identity Walden G730 Silvercreek T170 Charvell 150 SC Takimine G406s
|
|
#202
03-12-2018, 07:57 AM
|
|||
|
|||
|
Quote:
Young's Modulus is normalized for measurements. For instance, suppose I have a specimen of some material and it's 1 meter thick. If I apply 10 Pa of stress it may deform 0.01 m, so the strain is 0.01 m/1 m = .01 and the Young's Modulus is 10 Pa/.01 = 1000 Pa. If I apply 20 Pa of stress, it will deform 0.02 m, so the strain is .02 m/1 m = .02 and Young's Modulus is 20 Pa/.02 = 1000 Pa. It doesn't change. This is why it's useful (in the elastic regime). It can predict how the material will react when under stress.
__________________
Guild CO-2 Guild JF30-12 Guild D55 Goodall Grand Concert Cutaway Walnut/Italian Spruce Santa Cruz Brazilian VJ Taylor 8 String Baritone Blueberry - Grand Concert Magnum Opus J450 Eastman AJ815 Parker PA-24 Babicz Jumbo Identity Walden G730 Silvercreek T170 Charvell 150 SC Takimine G406s
|
|
#204
03-12-2018, 08:10 AM
|
|||
|
|||
|
Quote:
__________________
Fred
|
|
#205
03-12-2018, 09:24 AM
|
||||
|
||||
|
Quote:
Interesting to note and perhaps should be clarified that the French Brubaker tests , done at Taylor Guitars in 2007, were appearently testing 32 guitars from 7 different series , with 7 different back and side species materials, AND 2 different kinds of spruce top materials = Engelman and Sitka . Using what appears to be a handheld, modal impact hammer ... And thus the variations in the test results appear to be as much or more derived from being and spread out over 7 different variables of body/side material and two different spruce tops . (and not testing the variations within the same back, sides and top materiels ) Which is not surprising and which would seem to make the term "Significant difference " less significant "Significant" being ..... 2.24 hz variation and 2.23 % of the mean, ... spread out over the two different types spruce tops and 7 different body/side species ....  A few quotes from French / Brubaker : In all cases, the tops were made from either Sitka Spruce or Engelmann Spruce, so we assume any part of the natural frequency variation due to differences in materials is due to the back and side materials rather than top materials. The mean frequency is 100.3 Hz and the standard deviation is 2.24 Hz (2.23% of the mean frequency). It is also evident that the first resonant frequency is strongly correlated with the side and back material; Interesting to note the only constants in the test were in the size and shape of the body design of the guitars specifically the :Grand Auditorium" the type of X bracing design used and the bridge material So in reality the guitars may have actually ranged from the 114 series to 914 series And so the guitars measured may or may not actually represent 32 "top shelf" guitars Here are some other quotes from the French Brubaker paper. Finally, Figure 17 shows the isoplot made using the Helmholtz frequencies identified from the FRF plots. In contrast to the encouraging results from the first and second natural frequencies, this data does not satisfy the requirements of the isoplot method; the test variation is not small compared to the part variation. This is not a complete surprise since the signal to noise ratio at an anti-resonance is, by definition, small. As is typical for this type of test, we often noted a significant decrease in coherence at anti-resonance frequencies. Thus, trends suggested by the Helmholtz frequency data should be evaluated carefully (perhaps with more testing)before being accepted as being real. Conclusions Build variation is inversely related to build quality. With this in mind, we measured frequency response functions from a pool of acoustic guitars in the production facility of a large guitar manufacturer. We found that the standard deviation of the first natural frequencies was 2.23% of the mean frequency. The standard deviation of the second natural frequencies is 3.11% of the mean frequency. While there is some question about the quality of the Helmholtz frequencies measured from the test data, the standard deviation is low, 2.92% of the mean frequency. While the French Brubaker is interesting it does actually address my original question. But again it doesn't really matter because I am content to wait to play one.
__________________
Enjoy the Journey.... Kev... KevWind at Soundcloud KevWind at YouYube https://www.youtube.com/playlist?lis...EZxkPKyieOTgRD System : Studio system Avid Carbon interface , PT Ultimate 2023.12 -Mid 2020 iMac 27" 3.8GHz 8-core i7 10th Gen ,, Ventura 13.2.1 Mobile MBP M1 Pro , PT Ultimate 2023.12 Sonoma 14.4 Last edited by KevWind; 03-12-2018 at 01:14 PM.
|
|
#206
03-12-2018, 11:42 AM
|
|||
|
|||
|
Quote:
|
|
#207
03-12-2018, 11:51 AM
|
|||
|
|||
|
Quote:
Goldilox, one of my absolute favorites if you can get a singer to do it. rct
|
|
#208
03-12-2018, 12:03 PM
|
|||
|
|||
|
[King's X - Band]
Quote:
 I'll certainly will look for the albums from King's X. Already listening to the first :-) I think I heard 'Goldilox' before, but did not knew from whom it was. If you like King's X check out the polish band 'Riverside'. A bit different of course (some sort of progressive metal maybe), I like most of their albums a lot. For example 'Rapid Eye Movement'. Last edited by rpnfan; 03-12-2018 at 12:16 PM.
|
|
#209
03-12-2018, 01:07 PM
|
|||
|
|||
|
__________________
http://www.jessupegoldastini.com/
|


